
I. IN BRIEF
This section is a brief summary to help you quickly access the key information you need. If you want to dive deeper into the details, simply continue with the rest of the course.
II. INTRODUCTION
This article brings together the main mathematical and physical relationships a private pilot should understand. The goal is not to replace the POH/AFM, but to understand what is behind the performance charts, aircraft limitations, climb speeds, descent planning, turn performance, stall speed, fuel planning, and weight and balance calculations. The formulas below are tools for understanding, estimating, cross-checking and building pilot judgement.
III. Useful Constants and Units Gravity
1 kt = 1 NM/h ≈1.852 km/h ≈ 0.514 m/s
EXAMPLE
A 20 kt wind corresponds to 20 × 0.514 ≈ 10.3 m/s.
So, for quick mental calculations, divide the wind speed in knots by 2: 20 kt ≈ 10 m/s.
1 m ≈ 3.28 ft
EXAMPLE
I am flying at 9,000 ft. 9,000 / 3.28 ≈ 2,744 m.
I am flying at 5,000 m. 5,000 × 3.28 ≈ 16,400 ft. So, 5,000 m is approximately 16,400 ft.
1 kg ≈ 2.205 lb
1 lb ≈ 0.454 kg
1 US gal ≈ 3.785 L
1 hPa ≈ 27 ft
1 inHg ≈ 33.86 hPa
In the lower layers of the atmosphere, we can use the approximation: 1 hPa ≈ 27 ft.
Therefore, 37 hPa ≈ 1,000 ft.
Since 37 hPa is approximately equal to 1 inHg, we can say that 1 inHg ≈ 1,000 ft. This is why, for quick pilot calculations in the lower atmosphere, a pressure difference of 1 inHg is commonly treated as approximately 1,000 ft of pressure altitude difference.
IV. Standard Atmosphere and Altimetry
The International Standard Atmosphere (ISA) is the reference atmosphere used for aircraft performance, altimetry and flight planning.
IV.1 At Sea Level
Pressure = 1013.25 hPa / 29.92 inHg
Temperature = 15°C / 288.15 K
Density = 1.225 kg/m³
IV.2 In the troposphere
Temperature decreases approximately by 2°C per 1000 ft.
ISA temperature: ISA Temp = 15 − 2 × altitude /1000
EXAMPLE
At 6,000 ft, ISA Temp = 15 − 2 × 6 = 15 − 12 = 3°C. So, under ISA conditions, the standard temperature at 6,000 ft is approximately 3°C.
ISA deviation: ΔISA = OAT − ISA Temp
EXAMPLE
At 6,000 ft, ISA Temp ≈ 3°C. If OAT is 13°C, then ΔISA = 13 − 3 = +10°C. So the temperature is ISA +10.
IV.2.1 Pressure Altitude

Pressure altitude can be estimated from aerodrome elevation by correcting for the difference between standard pressure and the actual QNH. Use the first formula when QNH is given in hPa, and the second one when QNH is given in inHg.
EXAMPLE
Elevation = 1,000 ft, QNH = 1005 hPa. Pressure Alt. = Elevation + (1013 − QNH) × 30 = 1,000 + (1013 − 1005) × 30 = 1,000 + 8 × 30 = 1,240 ft.
So with QNH 1005 hPa, pressure altitude is about 240 ft higher than the aerodrome elevation.
EXAMPLE
Elevation = 1,000 ft, QNH = 29.68 inHg. PA = 1,000 + (29.92 − 29.68) × 1000 = 1,000 + 0.24 × 1000 = 1,240 ft.
So with QNH 29.68 inHg, pressure altitude is about 240 ft higher than the aerodrome elevation.
A more precise near-sea-level value is about 27 ft per hPa, but 30 ft per hPa is commonly used as a practical pilot rule of thumb.
IV.2.2 Density altitude

High temperature, low pressure and high humidity increase density altitude. High density altitude reduces engine power, propeller efficiency, lift production and climb performance.
For more definitions, examples and practical explanations, refer to our articles “Take-off, Climb and Landing Performance” and “Understanding Altimetry: A Practical Guide for Private Pilots.”
V. Air Density, Pressure and Temperature
V.1 The Ideal Gas Law
Good to know! The atmosphere is governed by the gas law:

Where
-
- p is pressure;
- ρ (rho) is air density;
- R is the gas constant;
- and T is temperature in Kelvin.
The gas law shows that density depends on:
-
- Pressure;
- Temperature.
EXAMPLE
If temperature increases while pressure stays the same, density must decrease.
If pressure decreases while temperature stays the same, density must decrease.
That is the physical origin of density altitude.
Density altitude is simply the altitude in the standard atmosphere that corresponds to the current air density.

(The lift formula will be explained later in the article.)

Lower density means the airplane behaves as if it were at a higher altitude.
Therefore, on a hot day or at high altitude:
-
- Takeoff roll increases;
- Climb performance decreases;
- True airspeed required for the same lift increases.
V.1.1 Connection to IAS and TAS
Your airspeed indicator measures dynamic pressure. The airflow enters the pitot tube, and the pressure difference between total pressure and static pressure is converted into an indicated airspeed on the airspeed indicator. Dynamic pressure (q) represents the kinetic energy per unit volume of a moving fluid. It is given by:
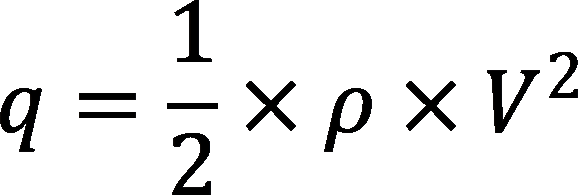
You do not need to memorize this formula to fly, but it helps to understand an important concept: if air density decreases (for example with increasing temperature or altitude) and you want to maintain the same indicated airspeed (which means the same dynamic pressure q), then true airspeed must increase. This is why, at a constant IAS, TAS increases with altitude.
That is why at constant IAS, TAS increases with altitude (We will discuss this later in this article). The instrument does not measure true speed. It measures pressure, and pressure depends on density.
V.1.2 Connection to Engine Power
A normally aspirated engine depends on air density.
Lower density means:
-
- Less oxygen per intake stroke;
- Less fuel burned;
- Less power produced.
Climb performance decreases because excess power decreases.
VI. AIRSPEED
VI.1 Airspeeds: IAS, CAS, EAS, TAS and GS
VI.1.1 IAS - Indicated Airspeed
Speed directly read on the airspeed indicator.
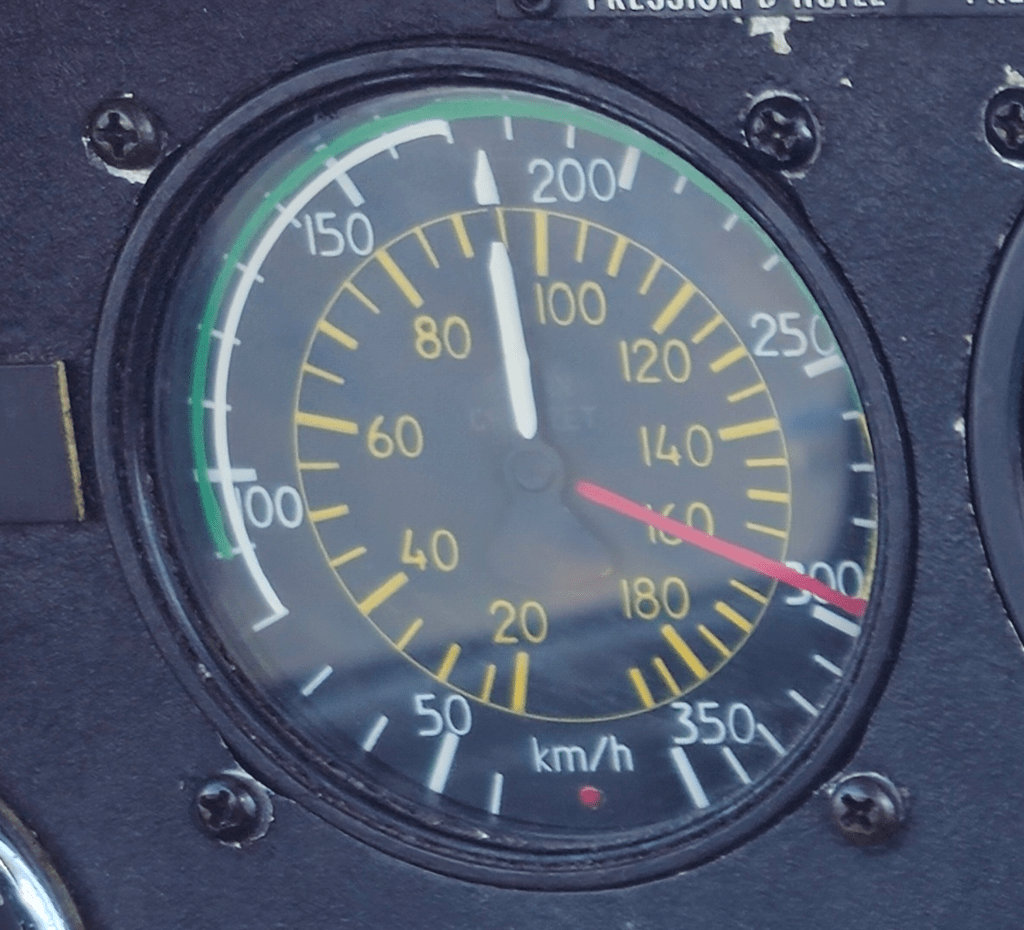
This is the most important speed for flying the aircraft because it reflects the aerodynamic forces acting on the aircraft structure and wings.
IAS is used for:
-
- Stall speeds;
- Flap operating speeds;
- Manoeuvring speed;
- Rotation speed;
- Approach speed;
- Aircraft limitations;
- Flying the aircraft in general.
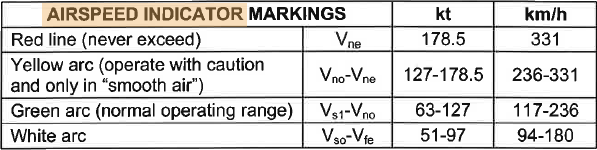
Here is an extract from a Robin Aircraft Flight Manual (AFM/POH). The speeds shown on the airspeed indicator are IAS (Indicated Airspeeds).
VI.1.2 CAS - Calibrated Airspeed
IAS corrected for position and instrument errors. At low speed in light aircraft, CAS is usually very close to IAS.
VI.1.3 EAS - Equivalent Airspeed
CAS corrected for compressibility effects. Mostly used in high-speed or high-altitude flight.
Rarely used in everyday PPL operations.
VI.1.4 TAS - True Airspeed
Actual speed of the aircraft through the air mass. TAS increases with altitude because air density decreases.
Calculating TAS
Quick estimation rule:
-
- +1% TAS per 600 ft of altitude
- +1% TAS per 5°C above ISA

For the same IAS, the aircraft must move faster through the air at higher altitude to produce the same dynamic pressure on the pitot tube.
TAS is mainly used for:
-
- Navigation;
- Flight planning;
- Performance calculations;
- Turn radius calculations;
- Wind correction calculations.
VI.1.5 GS - Ground Speed
Actual speed of the aircraft relative to the ground.
GS depends on wind:

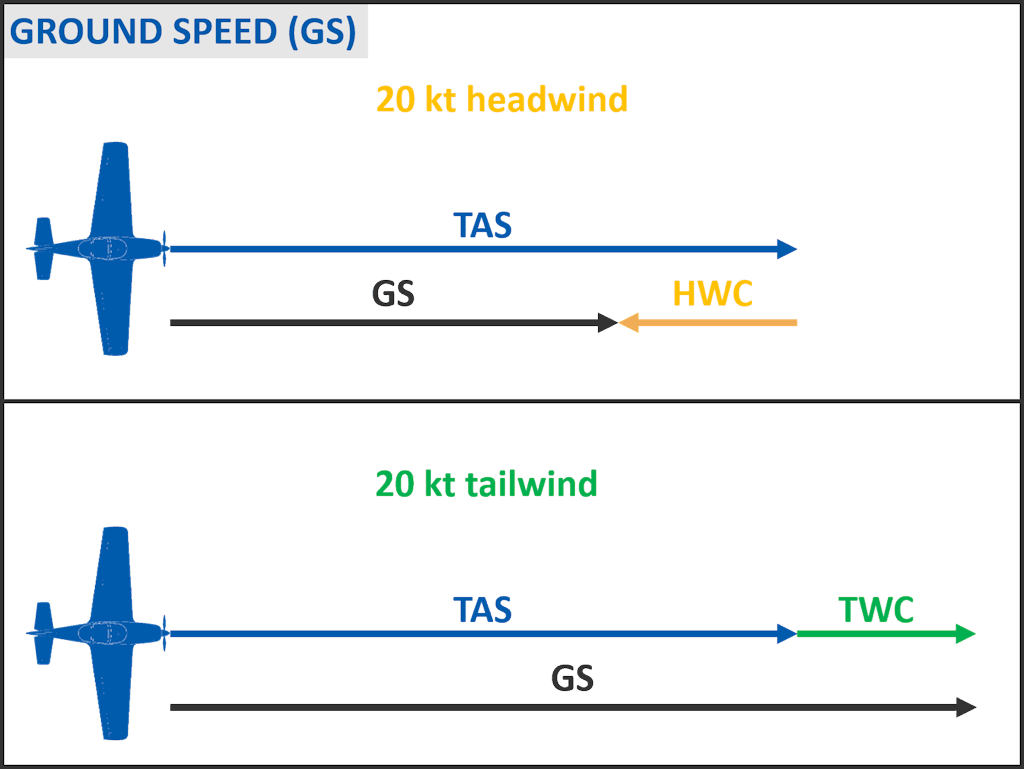
GS is mainly used for:
-
- Time calculations;
- ETA calculations;
- Navigation;
- Fuel planning.
VI.1.6 Why Do Airliners Use Mach Number?
This section is provided for general knowledge only and is not required for typical aeroclub operations or everyday PPL flying. However, if you are preparing for ATPL theoretical exams, you may already have studied these concepts in greater detail.
At high altitude, airliners fly at a high true airspeed and relatively close to the speed of sound.
As altitude increases air density decreases. For the same IAS, TAS increases.
Temperature generally decreases in the troposphere, so the local speed of sound decreases.
This means that an aircraft can have a moderate IAS, but still be flying at a high Mach number.
At low altitude, pilots mainly monitor IAS because aircraft handling and structural loads are linked to dynamic pressure. At high altitude, Mach number becomes increasingly important because compressibility effects may appear before reaching normal IAS limitations.
Local Speed of Sound (LSS) in knots

Mach Number

If the aircraft flies too close to the speed of sound:
-
- Shock waves may appear;
- Buffeting may occur;
Aircraft controllability may be affected.
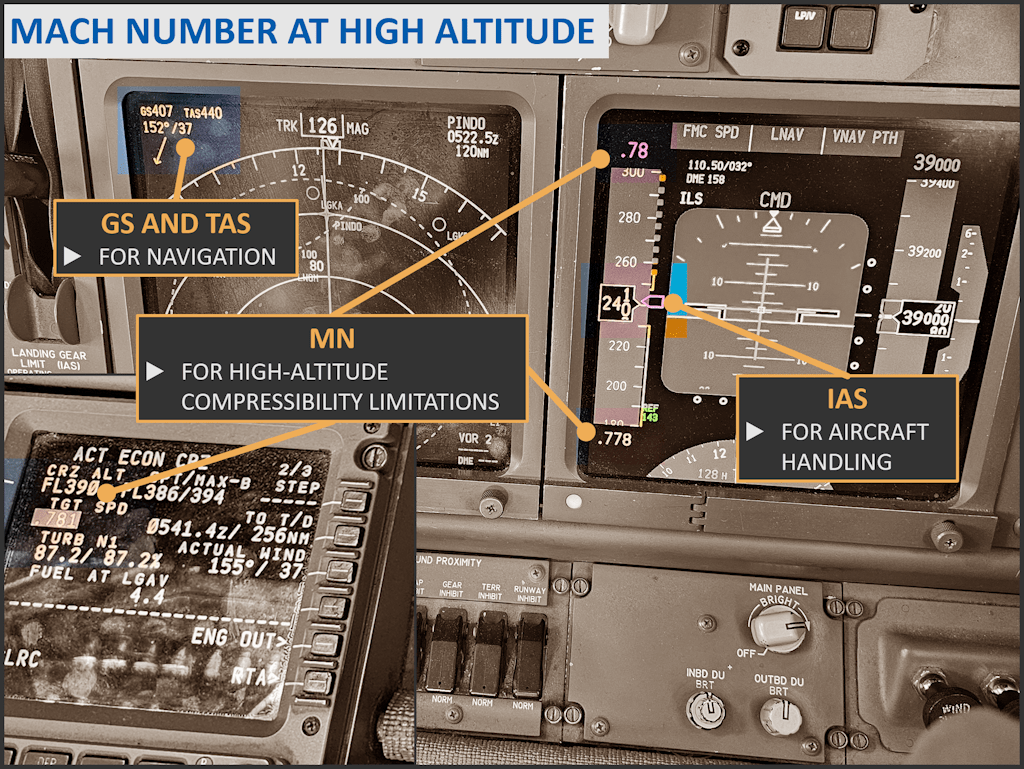
For this reason, airliners usually climb using IAS at lower levels, then switch to Mach number at higher altitude.
EXAMPLE
For this reason, airliners usually climb using IAS at lower levels, then switch to Mach number at higher altitude.
For this reason, airliners usually climb using IAS at lower levels, then switch to Mach number at higher altitude.
VI.2 Speed Factor
The speed factor is directly related to the aircraft ground speed (GS). It allows pilots to quickly estimate the flight time for a given distance.
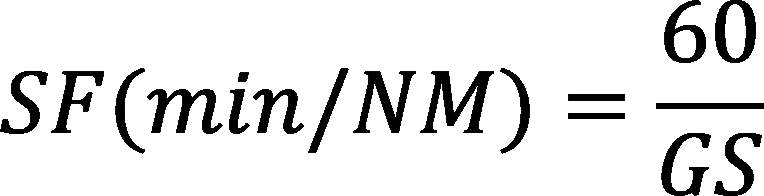
And :

EXAMPLE
At 100 kt:
SF = 60 / 100 = 0.6 min/NM
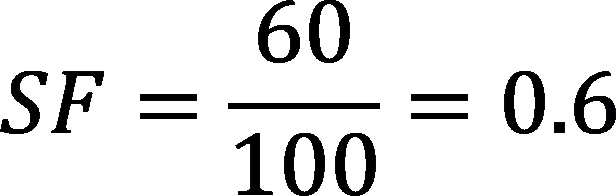
For a 30 NM leg:

The time to enter in the navigation log is therefore 18 minutes.
This table shows that at a groundspeed of 100 kt, the aircraft travels approximately 1.7 NM per minute. Therefore, in 18 minutes, the aircraft will travel about 30 NM, which confirms the previous example.
VII. Lift, Drag and Dynamic Pressure
VII.1 Dynamic pressure
As previously discussed:
VII.2 LIFT
With:
-
- Lift = aerodynamic lift force;
- ρ (rho) = air density;
- V = airspeed;
- S = wing surface area;
- CL = coefficient of lift.
Explanation:
-
- If speed increases, lift increases rapidly because of V²;
- A larger wing area produces more lift;
- Higher air density produces more lift;
- CL depends mainly on angle of attack and wing shape.
EXAMPLE
-
- Increasing angle of attack increases Cₗ and therefore lift;
- Deploying flaps also increases CL.
VII.3 Drag

With:
-
- Drag = aerodynamic drag force;
- ρ (rho) = air density;
- V = airspeed;
- S = reference surface area (usually wing area);
- CD = coefficient of drag.
Explanation:
-
- Drag also increases with V²;
- More drag is produced at high angle of attack;
- Flaps and landing gear increase CD;
Poor aerodynamic shape increases CD.
CL and CD are dimensionless coefficients representing how efficiently the aircraft generates lift and how much drag it produces.
VII.4 Gravitational acceleration

g is the standard acceleration caused by Earth’s gravity. It is approximately 9.81 m/s². In flight mechanics, it is used to calculate forces, weight, load factor, turn radius, climb performance, and many other aircraft performance relationships. This also means that, if an object is falling freely, its speed increases by about 9.81 metres per second every second. If an object is dropped from 50 metres, gravity accelerates it at about 9.81 m/s². Ignoring air resistance, it will hit the ground after about 3.2 seconds, with a speed of roughly 31 m/s, or 113 km/h.
VII.5 Weight

With:
-
- Weight = force due to gravity (N);
- Mass = quantity of matter (kg);
- g = gravitational acceleration (≈ 9.81 m/s²).
An aircraft with a mass of 1000 kg has a weight of approximately 9810 N on Earth.
VII.6 Forces in Flight
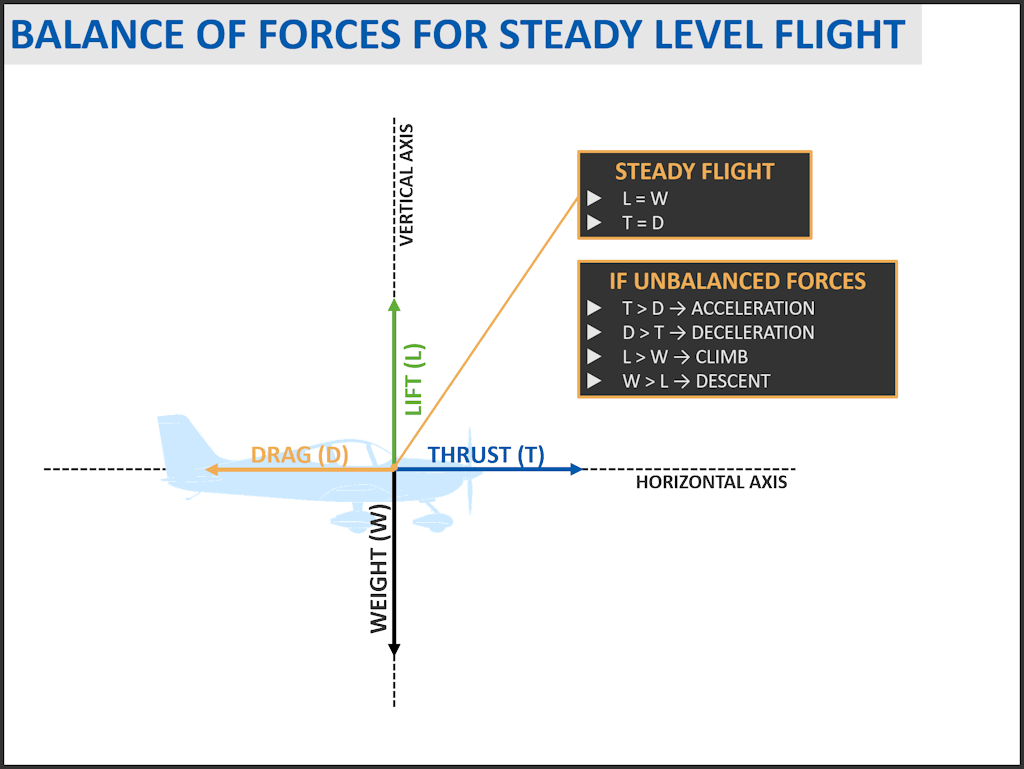
In straight-and-level flight, the aircraft is in equilibrium:

-
- Lift acts upward
- Weight acts downward
When both forces are equal, the aircraft maintains a constant altitude.
Thrust = Drag
-
- Thrust moves the aircraft forward
- Drag opposes the motion
When both forces are equal, the aircraft maintains a constant airspeed.
This situation corresponds to:
-
- straight flight;
- constant altitude;
- constant speed;
no acceleration.
As soon as the aircraft climbs, descends, or accelerates, these force balances are modified.
-
- Thrust greater than Drag → the aircraft accelerates
- Drag greater than Thrust → the aircraft decelerates
- Lift greater than Weight → the aircraft tends to climb
- Weight greater than Lift → the aircraft tends to descend
To better understand how aerodynamic forces behave during climbs, including the relationships between lift, drag, thrust, and weight, see our article: “Understanding VX and VY Climb Speeds”.
VIII. Drag Polar and Drag Curve
Total drag is the sum of parasite drag and induced drag:
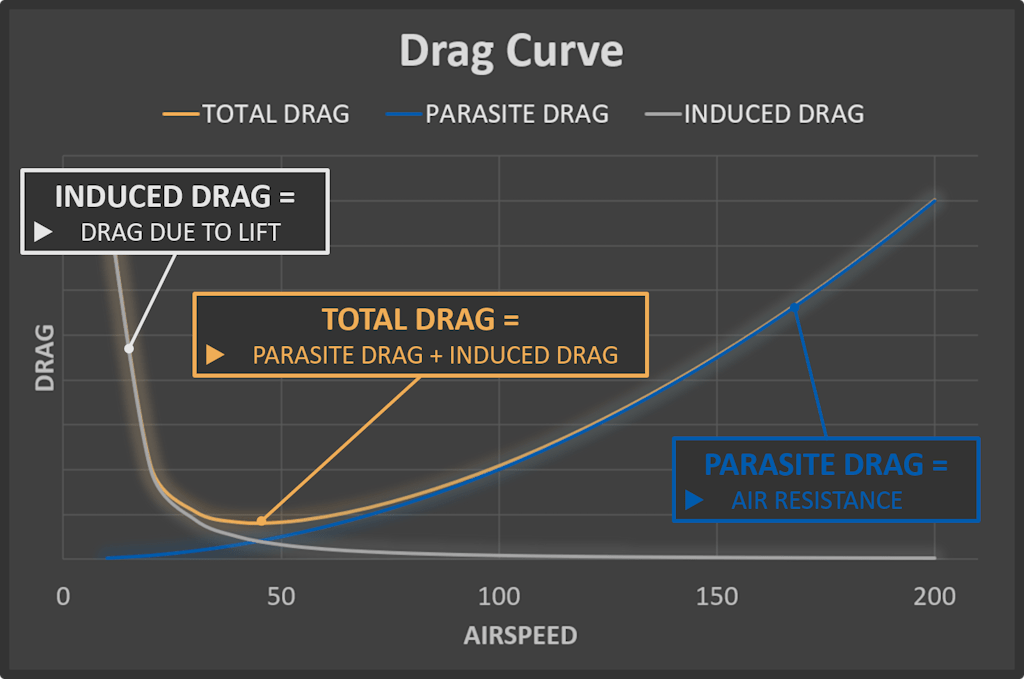
VIII.1 Parasite drag
Drag created by the aircraft moving through the air. It mainly comes from:
-
- skin friction;
- aircraft shape;
- landing gear;
- antennas;
- airflow separation.
Parasite drag increases with speed because the aircraft collides with more air molecules and aerodynamic resistance becomes stronger.
VIII.2 Induced drag
Drag created as a consequence of lift generation. When the wing produces lift, wingtip vortices and downwash appear, creating induced drag.
Induced drag is highest at low speed because the wing must operate at a higher angle of attack to generate enough lift. As speed increases, less angle of attack is required, so induced drag decreases.
VIII.2.1 Lift-to-drag ratio

At maximum L/D, the aircraft reaches its best aerodynamic efficiency: lift is high while drag is minimum.
See our article “Understanding VX and VY Climb Speeds” to better understand how drag affects climb angle and rate of climb.
IV. STALL
IV.1 Stall principle
A stall occurs when the critical angle of attack is exceeded. It is not directly caused by “low speed”.
At low speed, the wing must fly at a higher angle of attack to generate enough lift. If the critical angle of attack is exceeded, airflow separates and the wing stalls. Stall can therefore occur at any airspeed if the angle of attack becomes too high.
A stall occurs when the critical angle of attack is exceeded. It is not directly caused by “low speed”.
IV.2 Stall speed
You do not need to memorise this formula; it simply proves that stall speed depends on weight, air density, wing area, and maximum lift coefficient:
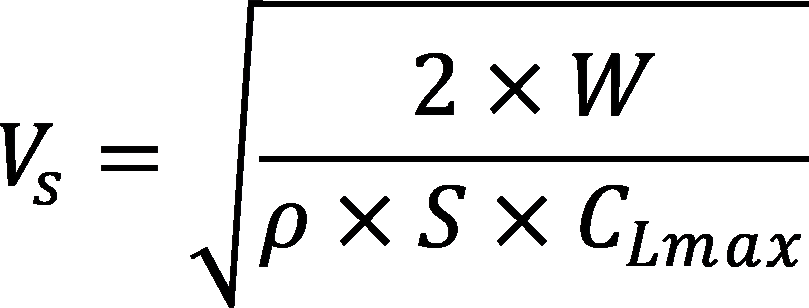
With:
-
- W = weight;
- ρ = air density;
- S = wing area;
- CLmax = maximum lift coefficient.
This formula shows that stall speed increases when:
-
- weight increases,
- air density decreases (true stall speed),
- CLmax
IV.2.1 Weight effect
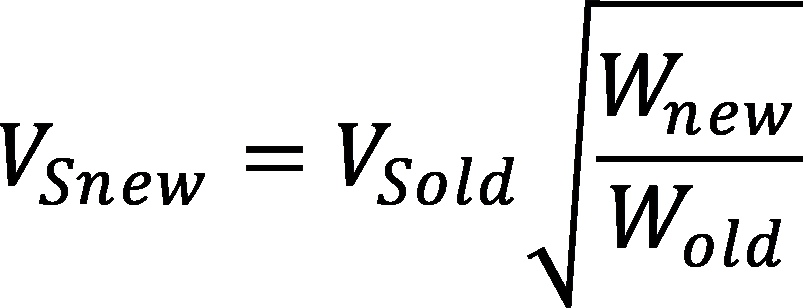
A heavier aircraft requires more lift. To produce this lift, the wing must fly at a higher angle of attack. As a result, stall speed increases with weight.
EXAMPLE
A 10% increase in weight increases stall speed by about 5%.
For most aeroclub aircraft, the manufacturer directly provides a published stall speed, usually determined at maximum mass and under standard atmospheric conditions.
IV.2.2 Ice and contamination
Ice, frost, or contamination disturb the airflow around the wing and reduce CLmax.
This causes:
-
- earlier airflow separation;
- higher drag;
- higher stall speed.
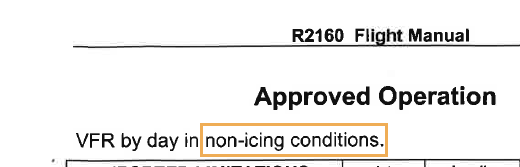
This is why regulations require a clean aircraft for take-off and why aircraft not approved for icing conditions must avoid icing conditions.
IV.2.3 Load factor and accelerated stall
Load factor (n) represents the ratio between lift and weight.
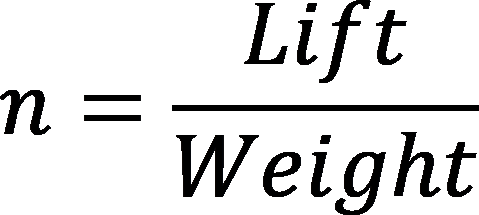
In straight-and-level flight:

In a coordinated level turn:
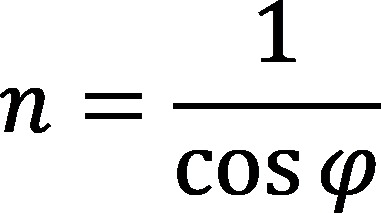
With:
-
- φ= bank angle.
As bank angle increases:
-
- load factor increases;
- required lift increases;
- angle of attack increase;
- stall speed increases.
New stall speed under load factor:

The aircraft can stall at a much higher speed when load factor increases.
This table shows the load factor associated with commonly used bank angles.
EXAMPLE
At 60° of bank in level flight, the load factor is 2 g. This means the aircraft must produce twice its weight in lift. If your stall speed is 90 kt IAS, the new stall speed becomes:

So, always keep a safety margin when using high bank angles.
Also remember: in a turn, if you do not add power, airspeed may decrease.
One of the most dangerous phases of flight is the base-to-final turn. Many pilots have stalled during this turn because they tried to avoid overshooting the runway centreline. At low height, a stall can leave almost no room for recovery.
IV.3 Gust and load factor
A vertical gust instantly changes the local angle of attack. This changes lift and therefore load factor. Strong gusts can momentarily increase angle of attack beyond the critical value and trigger an accelerated stall.
EXAMPLE
E.g. if the aircraft flies at 1.5 VS and a vertical gust suddenly increases the load factor to 2.5, the new stall speed becomes about 1.58 VS. The aircraft is therefore now flying below the new stall speed and may stall.
Flying faster increases structural load during gusts because lift varies with speed squared.
In general:
higher speed → higher gust loads,
lower speed → lower gust loads.
V. Turn Radius and Rate of Turn
V.1 True Airspeed and Turn Radius
For a given indicated airspeed, true airspeed increases when air density decreases. This means that altitude and temperature both matter. Higher altitude and temperature above ISA increase TAS, and this has a direct effect on turn radius.
Turn radius is proportional to the square of true airspeed. Therefore, even a moderate TAS increase can produce a significant increase in turn radius.
Calculating TAS
Quick estimation rule:
- +1% TAS per 600 ft of altitude
- +1% TAS per 5°C above ISA
EXAMPLE
120 kt IAS at 10,000 ft and ISA +15°C
-
- Altitude correction: 10,000 / 600 = 16.7%
- Temperature correction: 15 / 5 = 3%
- Total correction: approximately 20%
- TAS ≈ 120 × 1.20 = 144 kt
Calculating Turn Radius
Turn radius depends on true airspeed and bank angle:
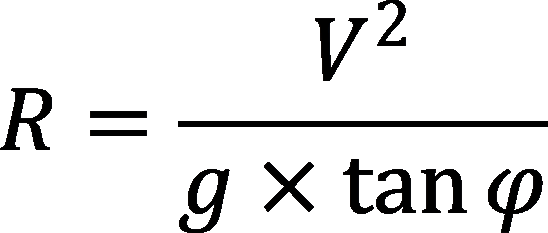
Where:
-
- R = turn radius
- V = true airspeed
- g = gravity = 9.81 m/s²
- φ = bank angle
For consistency, we use SI units. Since g is expressed in m/s², speed must be converted into m/s.
EXAMPLE
at 120 kt and 30° bank
120 kt ≈ 222 km/h
222 km/h = 222,000 m/h
222,000 / 3,600 ≈ 62 m/s
R = 62² / (9.81 × tan 30°)
R ≈ 680 m
at 144 kt and 30° bank
144 kt ≈ 267 km/h
267 km/h = 267,000 m/h
267,000 / 3,600 ≈ 74 m/s
R = 74² / (9.81 × tan 30°)
R ≈ 967 m
Result
At the same bank angle, the turn radius increases from approximately 680 m to 967 m.
That is an increase of about 43%. If you want the diameter of the turn, simply multiply by 2.
At the same bank angle, the turn diameter increases from approximately 1,360 m to 1,934 m.
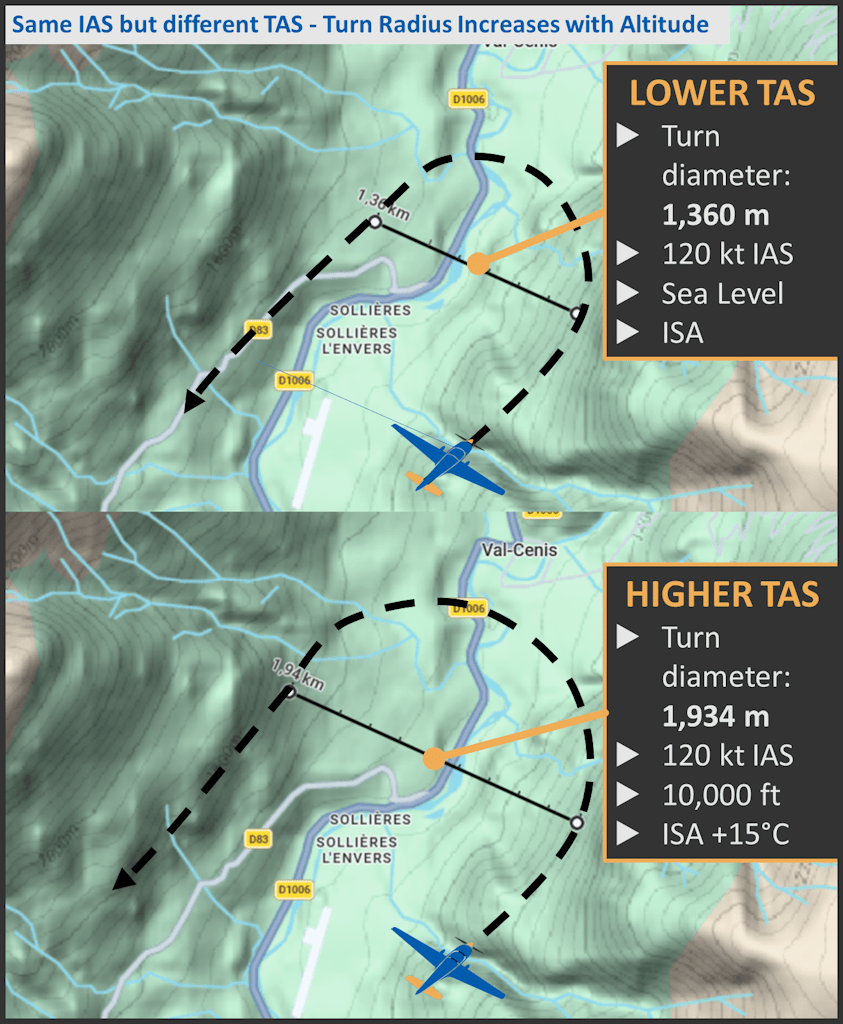
At the same indicated airspeed, flying hot and high increases true airspeed. For the same bank angle, this increases turn radius significantly. In a narrow valley, this can be the difference between a safe turn and no turn at all.
V.2 Rate of turn
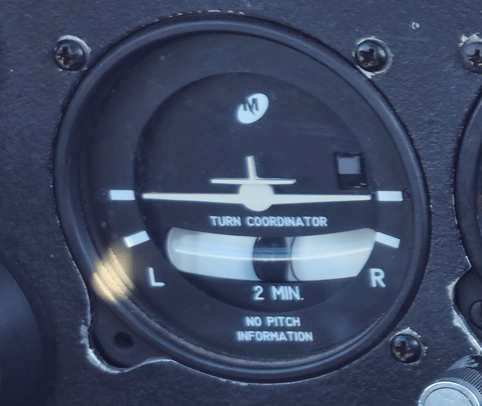
Rate of turn tells you how fast your heading changes.
The rate of turn is the speed at which the aircraft changes heading. It is usually expressed in degrees per second.
Rate of turn depends on:
-
- Bank angle
- Airspeed.

With:
Rate of Turn in degrees per second;
Bank angle in degrees;
TAS in knots.
For the same bank angle, a faster aircraft turns more slowly in terms of heading change per second.
V.2.1 Standard Rate Turn
A standard rate turn is 3° per second. This means 360° = 2 minutes or 180° = 1 minute.
Quick formula for standard rate bank angle:

EXAMPLE
At 120 kt:
Bank Angle ≈ 120 / 10 + 7 ≈ 19° or 12 x 1.5 ≈ 18°
So, at approximately 120 kt, a bank angle of about 18-19° gives a standard rate turn.
In other words, for a standard-rate turn, the required bank angle is approximately equal to 15% of the TAS.
V.2.2 Time to Turn
Turn radius tells you how much space you need.
To calculate the time required for a heading change:

EXAMPLE
If the aircraft turns at 3°/s and you need to turn 180°: Time = 180 / 3 = 60 seconds
So, a 180° turn at standard rate takes 1 minute.
VI. WORK AND POWER
In physic we talk about WORK and POWER. WORK represents the amount of energy transferred by a FORCE moving an object over a DISTANCE. POWER is the rate of doing a WORK. It represents how quickly energy is transferred or used.


This concept is important to understand where VX and VY come from. For a more detailed explanation, refer to our article: Understanding VX and VY Climb Speeds.
VII. ENERGY
Kinetic energy:
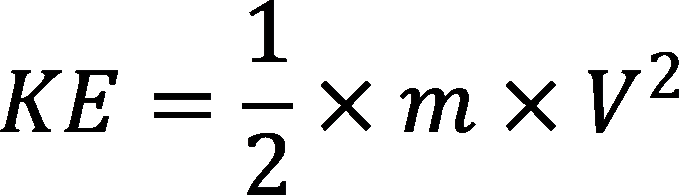
Potential energy:

Total mechanical energy:

Speed and altitude are both forms of energy. A pilot is constantly managing energy.
During an approach, if you are too high but still slow, you may still have options: increase the rate of descent, allow the speed to increase if appropriate, and regain a stable approach. In this case, part of the aircraft’s potential energy (altitude) is converted into kinetic energy (speed).
However, if you are both too high and too fast, the aircraft has excess energy. You must then use the techniques taught by your instructor to regain the correct profile, such as extending the flight path, using drag, configuring earlier, or increasing descent while remaining within limitations.
VIII. Power Required, Power Available and Excess Power Power required


Climb rate depends on excess power. More excess power means better rate of climb. For propeller aircraft, VY is the speed giving the maximum excess power and therefore the maximum rate of climb.
IX. Climb Geometry
In a climb, the flight path is inclined by an angle γ. Vertical speed: ROC = TAS × sinγ Horizontal speed: Horizontal speed = TAS × cosγ For small climb angles: sinγ ≈ tanγ cosγ ≈ 1 Therefore: tanγ ≈ ROC / TAS This relationship explains why climb angle and climb rate are different.
X. Forces in a Climb
In a climb, all forces maintain the same direction relative to the aircraft, except for weight, which is always directed vertically downward toward the center of the Earth.
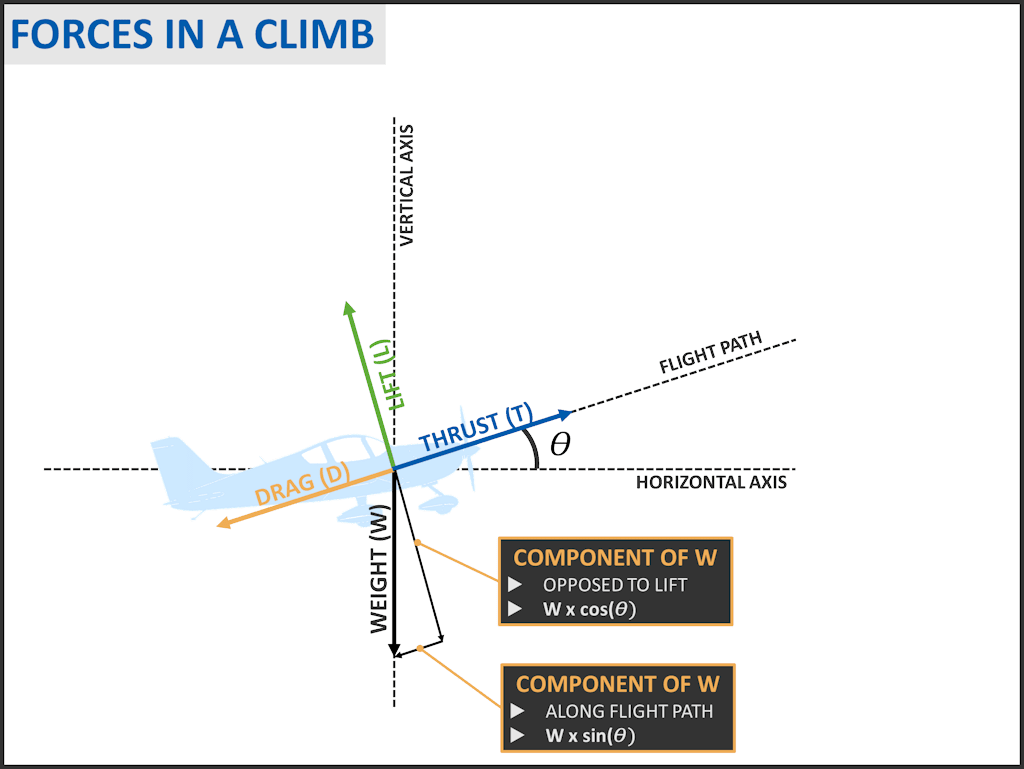
During a climb, weight (W) does not only act downward; it also has a component acting backward along the flight path. This component opposes the motion and must be overcome by thrust. This component is often referred to as the rearward component of weight. It acts in the same direction as drag, but it is not an aerodynamic force.
This component is equal to:

To maintain a constant speed in a climb, thrust must balance both drag and this additional component of weight:
Thrust = Drag + Weight x sin Θ
Rearranging:

This shows that the climb angle depends directly on the difference between thrust and drag.
The weight (W) is almost constant during the flight. Maximizing the climb angle is equivalent to maximizing Thrust – Drag. This quantity is called excess thrust (T – D). VX is the speed at which excess thrust (T − D) is maximum.
XI. Climb
XI.1 Climb gradient
Climb gradient is often misunderstood because pilots naturally look at rate of climb first. However, for obstacle clearance, terrain, or departure procedures, what really matters is not only how fast the aircraft climbs vertically, but how much altitude it gains over a given horizontal distance.
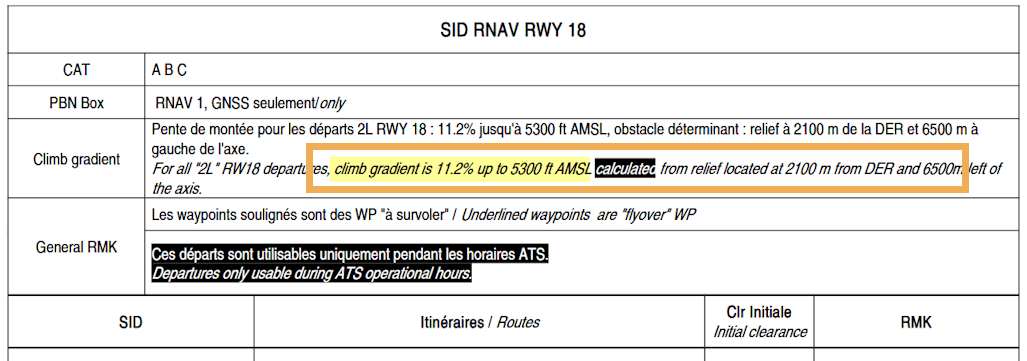
Extract from the French AIP: AD 2 LFLB SID RWY 18 RNAV INSTR 03.
For training and illustration purposes only. Do not use for flight. Always refer to the official AIP website for the latest valid version.
Climb gradient measures the altitude gained compared with the horizontal distance travelled.

It can be expressed as:
-
- a percentage,
- an angle,
- or a value in ft/NM.
For pilots, ft/NM is often the most practical unit because charts, procedures, navigation logs, and terrain distances are usually expressed in nautical miles.
XI.2 Climb gradient vs Rate of Climb
Climb gradient tells you how many feet the aircraft gains per nautical mile travelled.
Rate of climb tells you how many feet per minute the aircraft gains.
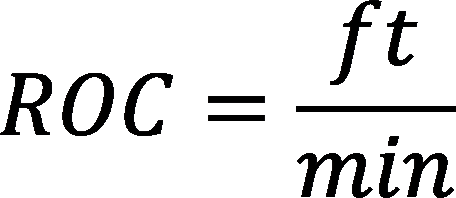
An aircraft may have a good rate of climb but a poor climb gradient if its groundspeed is high.
An aircraft climbing at 600 ft/min with a groundspeed of 60 kt gains 600 ft per NM.
The same aircraft climbing at 600 ft/min with a groundspeed of 120 kt gains only 300 ft per NM.
The rate of climb is the same, but the climb gradient is not.
XI.3 Air Gradient and Ground Gradient
Do not confuse air gradient and ground gradient.
Air gradient is the climb gradient relative to the air mass. It uses TAS because TAS is the aircraft’s speed through the air.

Ground gradient is the climb gradient relative to the ground. It uses GS because GS is the aircraft’s speed over the ground.

This difference matters because wind changes groundspeed.
With a headwind:
-
- GS decreases;
- The aircraft covers less ground for the same rate of climb;
- Ground climb gradient improves.
With a tailwind:
-
- GS increases;
- The aircraft covers more ground for the same rate of climb;
- Ground climb gradient decreases.
This is why a headwind helps obstacle clearance, while a tailwind can seriously degrade it.
For obstacle clearance, terrain avoidance, and departure procedures, ground gradient is usually the key value because the obstacle is fixed on the ground.
XI.4 Gradient in Percent
A gradient can be expressed as a percentage.

For a flight path angle γ:

EXAMPLE
A 5% climb gradient means the aircraft gains 5 units vertically for every 100 units horizontally.
In aviation terms: 5% means approximately 5 ft gained for every 100 ft travelled horizontally.
XI.5 Converting Gradient to ft/NM
One nautical mile is approximately 6076 ft.

So:

EXAMPLE
3% ≈ 180 ft/NM
5% ≈ 300 ft/NM
8% ≈ 480 ft/NM
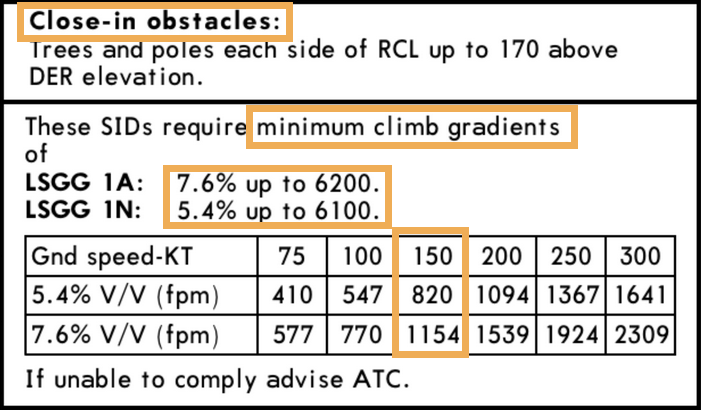
This is useful for quickly understanding departure or obstacle requirements. This is an example of a required climb gradient on an IFR departure. At 150 kt ground speed, maintaining a minimum climb gradient of 7.6% requires at least 1,154 ft/min.
XI.6 Operational Formula
The practical formula for climb gradient in ft/NM is:

With:
-
- ROC in ft/min;
- GS in kt;
- Gradient in ft/NM.
Why 60? Because 1 kt = 1 NM per hour, and there are 60 minutes in one hour.
EXAMPLE
-
- ROC = 600 ft/min;
- GS = 120 kt;
- Gradient = 60 × 600 / 120;
- Gradient = 300 ft/NM.
So the aircraft gains 300 ft for each nautical mile travelled over the ground.
EXAMPLE
A chart requires a 5.4% climb gradient, and your climb groundspeed is 150 kt.
Remember:
Gradient (%) × 60 ≈ Gradient (ft/NM)
So:
5.4 × 60 = 324 ft/NM
ROC = 324 × 150 / 60 ≈ 810 ft/min
The table gives 820 ft/min, which confirms the quick estimate.
XI.7 VX and Climb Gradient
VX is the best angle of climb speed. It gives the best climb gradient because it maximises altitude gained over horizontal distance.
This is why VX is used when obstacle clearance is critical, while VY is used to reach altitude in minimum time once obstacles are no longer a factor.
For a deeper explanation, refer to our article: Understanding VX and VY Climb Speeds.
XII. DESCENT GRADIENT AND DESCENT PLANNING
Descent gradient is the opposite concept. Instead of measuring altitude gained over distance, it measures altitude lost over distance.

As with climb gradient, it can be expressed as:
-
- a percentage;
- an angle;
- or ft/NM.
XI.7 Rate of Descent vs Descent Gradient
Rate of descent tells you how many feet per minute the aircraft loses.
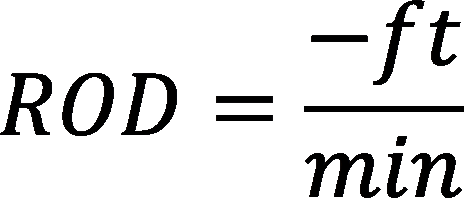
Descent gradient tells you how many feet the aircraft loses per nautical mile.
Again, groundspeed is important. At a higher groundspeed, the aircraft covers more distance in the same time. Therefore, for the same rate of descent, the descent gradient becomes shallower.
EXAMPLE
ROD = 500 ft/min
At 100 kt GS:
The aircraft travels about 1.67 NM per minute.
Descent gradient ≈ 300 ft/NM.
At 150 kt GS:
The aircraft travels 2.5 NM per minute.
Descent gradient ≈ 200 ft/NM.
With a tailwind, your groundspeed increases, so you cover more distance during the descent. Anticipate your descent earlier. With a headwind, your groundspeed decreases. In the event of an engine failure, the distance covered over the ground will be shorter, which may limit your options when selecting a suitable landing area.
If you want to land on a selected point with a headwind, you may need to aim beyond it to compensate for the reduced groundspeed. This technique is not covered in this chapter. Discuss it with your flight instructor as a priority.
XI.8 The 3° Descent Profile
A standard approach path is approximately 3°. This makes descent planning easier: it helps you estimate the top of descent, monitor your descent profile, and avoid arriving too high or too low near the aerodrome.
A 3° descent path corresponds to about: 318 ft/NM
For mental calculations, pilots often use: 300 ft/NM
This means that on a 3° path, the aircraft should lose about 300 ft every nautical mile.
EXAMPLE
-
- 1 NM ≈ 300 ft
- 3 NM ≈ 900 ft
- 5 NM ≈ 1500 ft
- 10 NM ≈ 3000 ft
XI.8.1 Top of Descent
For mental calculation:

EXAMPLE
Altitude to lose = 6500 ft
-
- TOD ≈ 3 × 6.5
- TOD ≈ 20 NM
So, from 6500 ft above the target altitude, start descent about 20 NM before the target point to follow an approximate 3° profile.
EXAMPLE
If you are descending 15 NM before arrival, on a 3° profile you should be approximately:
-
- 15 × 300 ft = 4500 ft above the aerodrome
So, if your altimeter indicates 5500 ft QNH and the aerodrome elevation is approximately 1000 ft, you are 4500 ft above the aerodrome. In this case, you are on the correct descent profile.
XI.8.2 Rate of Descent on a 3° Path
The required rate of descent depends on groundspeed.
For a 3° path: ROD ≈ GS × 5.3
Mental rule: ROD ≈ GS × 5

EXAMPLE
-
- 80 kt GS → about 400 ft/min
- 100 kt GS → about 500 ft/min
- 120 kt GS → about 600 ft/min
- 140 kt GS → about 700 ft/min
This is why faster aircraft need a higher rate of descent to stay on the same descent path.
In typical aeroclub aircraft, which are usually non-pressurised, passenger comfort should also be considered during descent. Avoid excessive rates of descent when possible.
A descent rate of about 500 to 700 ft/min is generally more comfortable.
Using 500 ft/min is also practical because it makes mental calculations easier.
Example:
If you need to lose about 6500 ft:
6500 / 500 = 13 minutes
So, at 500 ft/min, the descent will take approximately 13 minutes.
XII. WIND EFFECT ON NAVIGATION
XII.1 Basic Definitions
Before calculating wind correction, drift, or headings, you must clearly understand the difference between track and heading. In still air, the aircraft moves in the same direction as its nose is pointing. In that case, heading and track are the same. With wind, this is no longer true. The aircraft may be pointing in one direction, but the air mass is moving at the same time. As a result, the aircraft follows a different path over the ground.
This is why pilots must understand:
-
- Heading: where the aircraft nose is pointing;
- Track: the actual path followed over the ground;
- Drift: the angular difference between heading and track;
- Wind correction angle: the correction applied into wind to maintain the desired track;
- Groundspeed: the speed of the aircraft over the ground.
EXAMPLE
If the aircraft is heading 090° but a wind from the right pushes it left, the aircraft track may become 080°. The aircraft is pointing east, but it is moving slightly north of the intended route.
To maintain the planned track, the pilot must point the aircraft slightly into wind. This is called the wind correction angle.
-
- In still air: Heading = Track
- With wind Heading ≠ Track
The difference between heading and track is caused by drift.
XII.1.1 True, Magnetic and Compass References
Directions can be referenced to different north references.
True direction = Direction referenced to True North.
Magnetic direction = Direction referenced to Magnetic North.
Compass direction = Direction shown on the magnetic compass, affected by compass deviation.
You may therefore find:
True Track (TT) = The planned route over the ground, referenced to True North.
Magnetic Track (MT) = The planned route over the ground, referenced to Magnetic North.
True Heading (TH) = The aircraft heading referenced to True North.
Magnetic Heading (MH) = The aircraft heading referenced to Magnetic North.
Compass Heading (CH) = The heading to steer on the compass.
XII.1.2 Variation and Deviation
Variation = The angle between True North and Magnetic North.
Deviation = The error caused by the aircraft’s magnetic environment affecting the compass.
Simple memory rule:

East is least, West is best is often used in some training environments, but the safest method is to use your chart, compass correction card, and the sign convention taught by your instructor.
XII.2 The Wind Triangle
The wind triangle is a vector diagram showing how airspeed, wind and groundspeed combine.
-
- TAS represents the aircraft speed through the air mass;
- Wind represents the movement of the air mass over the ground;
- GS represents the aircraft movement over the ground.
In simple terms:

A crosswind mainly affects track. A headwind or tailwind mainly affects groundspeed.
XII.1.2 Variation and Deviation
XII.3 Angle to the Wind
The angle to the wind is the angle between the aircraft track and the wind direction.
If the wind is directly ahead:
-
- angle to wind = 0°;
- headwind is maximum;
- crosswind is zero.
If the wind is directly from the side:
-
- angle to wind = 90°;
- crosswind is maximum;
- headwind/tailwind is zero.
If the wind is directly behind:
-
- angle to wind = 180°;
- tailwind is maximum;
- crosswind is zero.
XII.4 Wind Components Formulae
XII.4.1 Crosswind component

XII.4.2 Headwind or tailwind component

EXAMPLE
Wind speed: 30 kt
Angle to wind: 60°
Crosswind = 30 × sin60 ≈ 26 kt
Headwind = 30 × cos60 = 15 kt
So the aircraft has about 26 kt of crosswind and 15 kt of headwind.
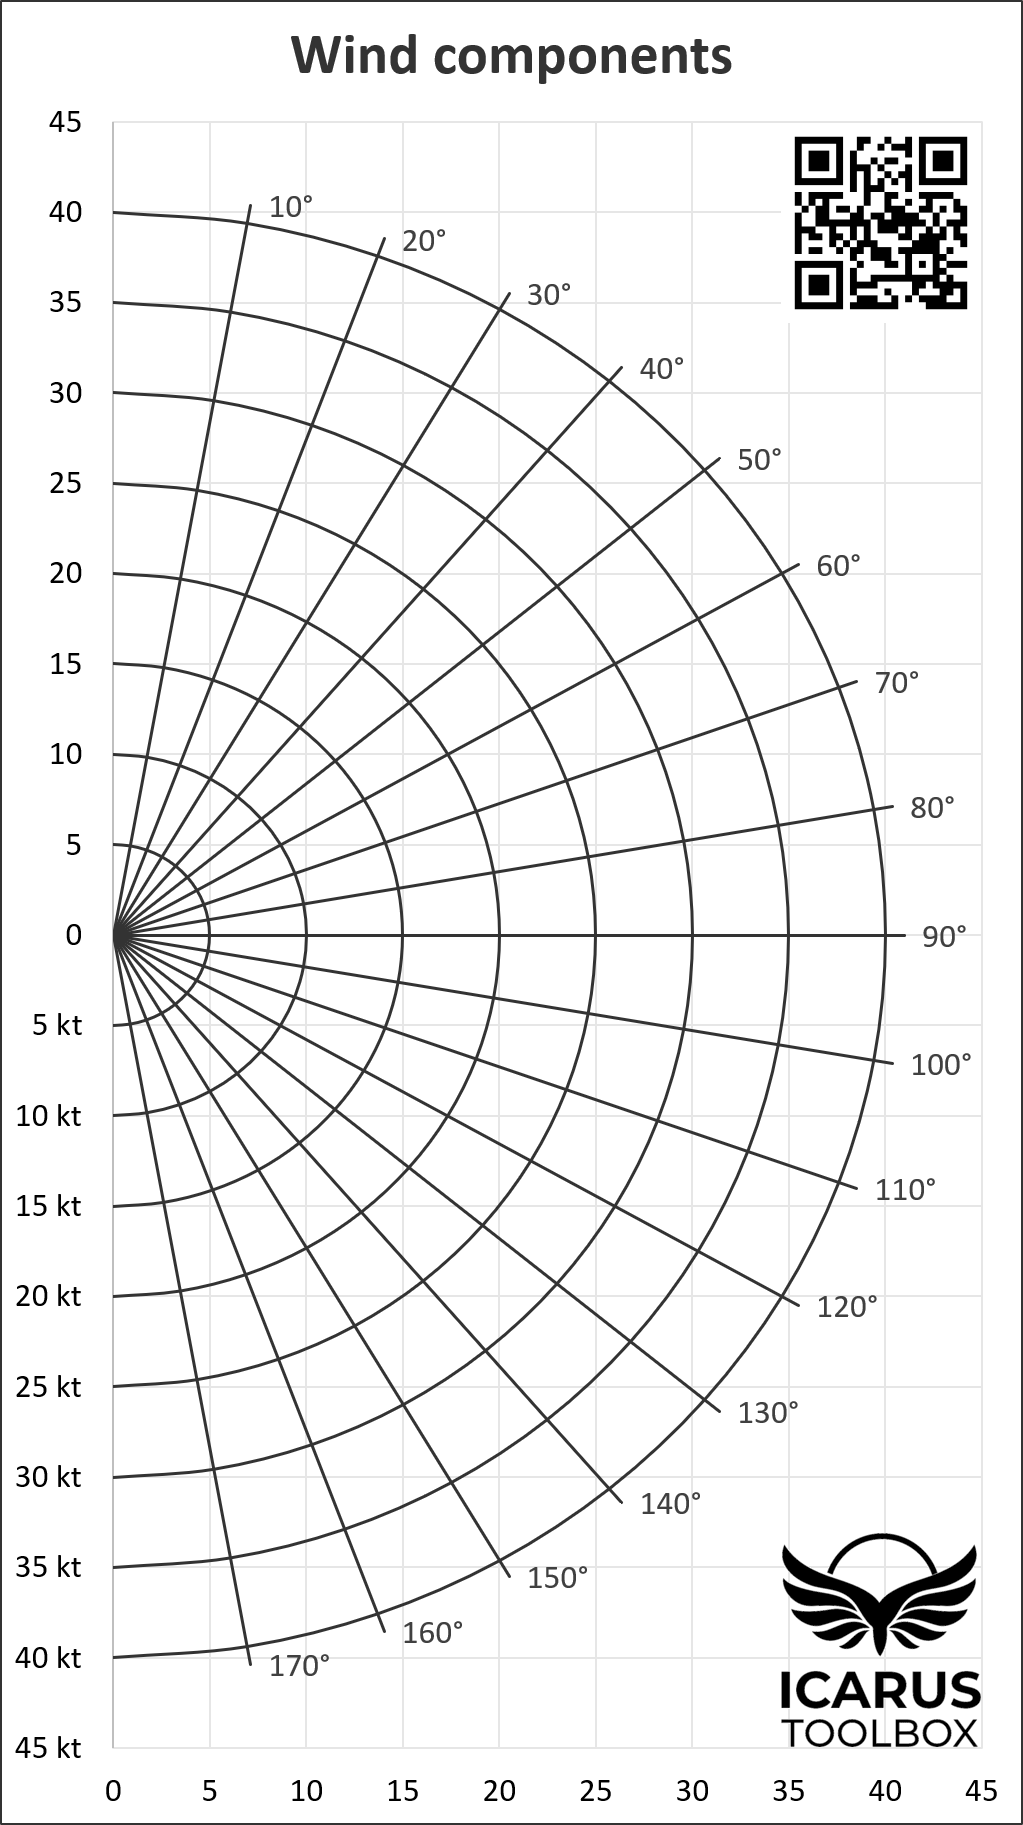
You can use our wind component chart (downloadable later in this article or available in the Toolbox section) to quickly estimate crosswind, headwind, and tailwind components.
XII.5 Groundspeed
Groundspeed is the speed of the aircraft over the ground.
As seen before:
XII.6 Drift Angle
Drift angle is the angle between the aircraft heading and its track over the ground.
-
- If the wind comes from the right, the aircraft drifts left;
- If the wind comes from the left, the aircraft drifts right.
To maintain the desired track, the pilot applies a Wind Correction Angle (WCA) into wind.
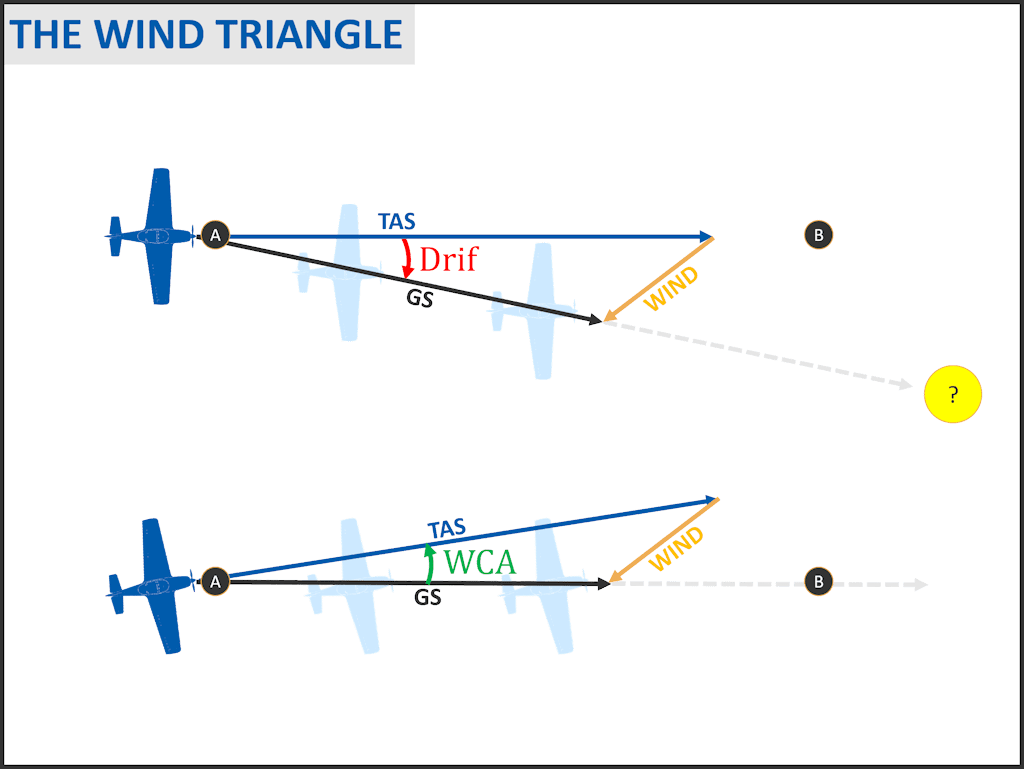
The planned route on the chart is a track. The heading to fly is calculated after applying wind correction.
With crosswind:
- The aircraft drifts away from the planned track;
- The pilot must point the aircraft into wind.
This correction is called the Wind Correction Angle (WCA).
So:
Heading = Track ± Wind Correction Angle
EXAMPLE
-
- Planned track: 090°
- Wind from the right
- Estimated drift: 8°
Heading to fly: 098°. The aircraft points 8° into wind to maintain the 090° track.
XII.7 Maximum Drift
Maximum drift occurs when the wind is exactly 90° to the track.
A practical mental method is:


EXAMPLE
-
- TAS = 120 kt
- Wind speed = 30 kt
Speed Factor = 60 / 120 = 0.5 → Maximum Drift = 30 × 0.5 = 15°
So, with a 30 kt full crosswind at 120 kt TAS, the maximum drift is approximately 15°.
XII.7.1 Drift with Partial Crosswind
If the wind is not a full crosswind, first estimate the crosswind component.
Then:

EXAMPLE
-
- TAS = 120 kt
- Wind: 30 kt
- Angle to wind: 60°

Speed Factor = 60 / 120 = 0.5 → Drift ≈ 26 × 0.5 = 13°
The pilot should apply approximately 13° of wind correction into wind.
XII.7.2 Example with Headwind Component
Planned track: 090°
TAS: 120 kt
Wind: 060° / 20 kt
Distance: 60 NM
The wind is 30° off the nose from the left.
Headwind component:

Crosswind component:

Groundspeed:
-
- GS = 120 − 17 = 103 kt
- Speed Factor: 60 / 120 = 0.5
- Drift: 10 × 0.5 = 5°
The wind comes from the left, so correct left.
Heading to fly: 090° − 5° = 085°
Time: Time = 60 / 103 × 60 ≈ 35 minutes
XII.8 Correcting an Off-Track Error
If no drift correction is applied, the aircraft may move away from the planned route.
A simple rule based on the 1-in-60 rule is:

EXAMPLE
After 60 NM, the aircraft is 10 NM off track.
Track Error = 60 × 10 / 60 = 10°
This means the aircraft has drifted approximately 10° from the planned track.
To regain the route, the pilot must:
correct the heading to stop further drift, and add an additional correction to return to the planned track.
Speed Factor = 60 / 120 = 0.5 → Drift ≈ 26 × 0.5 = 13°
The pilot should apply approximately 13° of wind correction into wind.
XII.9 Wind Component Chart
This chart is used to quickly find the wind components for a runway or a navigation track.
-
- The upper half of the chart gives a headwind component.
- The lower half of the chart gives a tailwind component.
- The bottom scale gives the crosswind component.
It allows you to estimate:
-
- Crosswind component: the part of the wind acting sideways;
- Headwind component: the part of the wind acting from ahead;
- Tailwind component: the part of the wind acting from behind.
How to use the chart
1. Find the angle between the wind direction and the runway direction or planned track.
Example:
-
- Runway 13 → 130°
- Wind: 190° / 30 kt
Angle between runway and wind: 190° − 130° = 60°
2. Follow the corresponding angle line on the chart.
Crosswind component ≈ 26 kt
Headwind component ≈ 15 kt
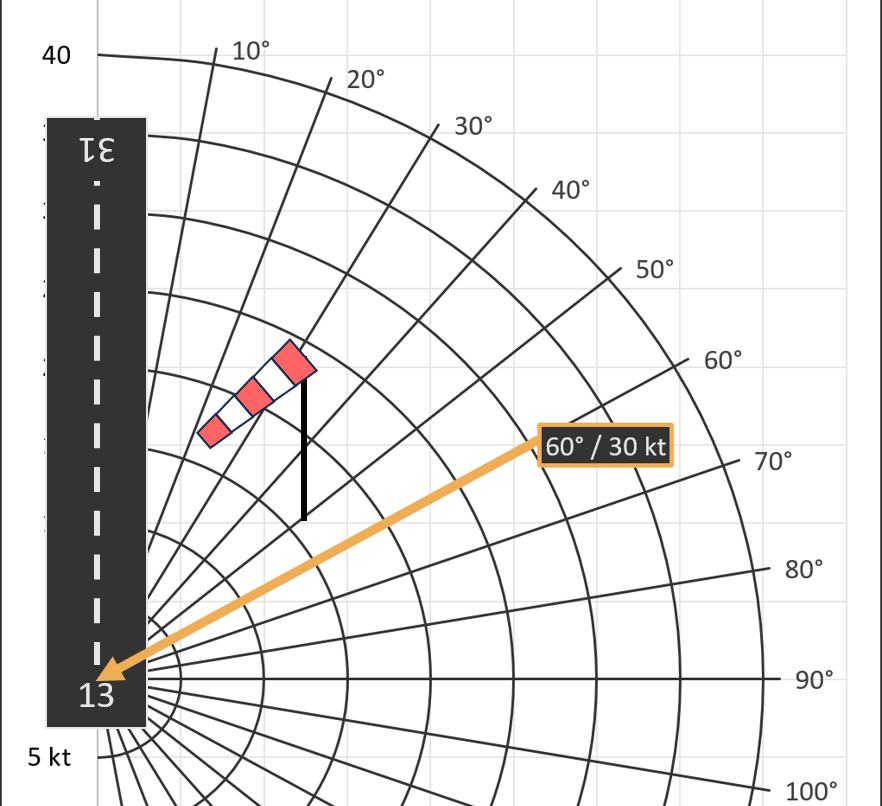
3.Move along this line until you reach the wind speed arc (30 kt).
4.Read the crosswind component on the bottom scale (26 kt).
5.Read the headwind component on the left scale (15 kt).
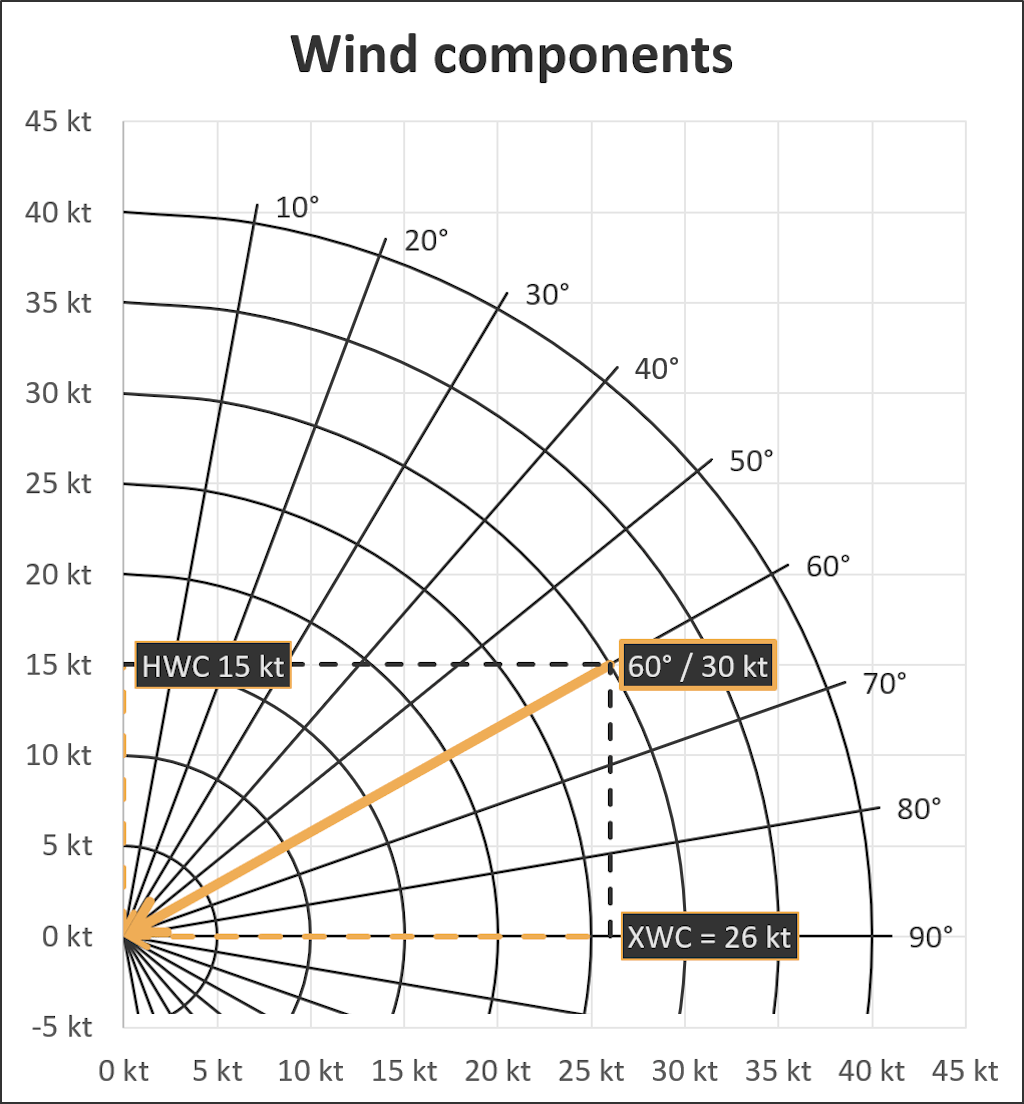
This means the aircraft has approximately 26 kt of crosswind and 15 kt of headwind.
XII.9.1 Quick Headwind, Tailwind & Crosswind Estimation
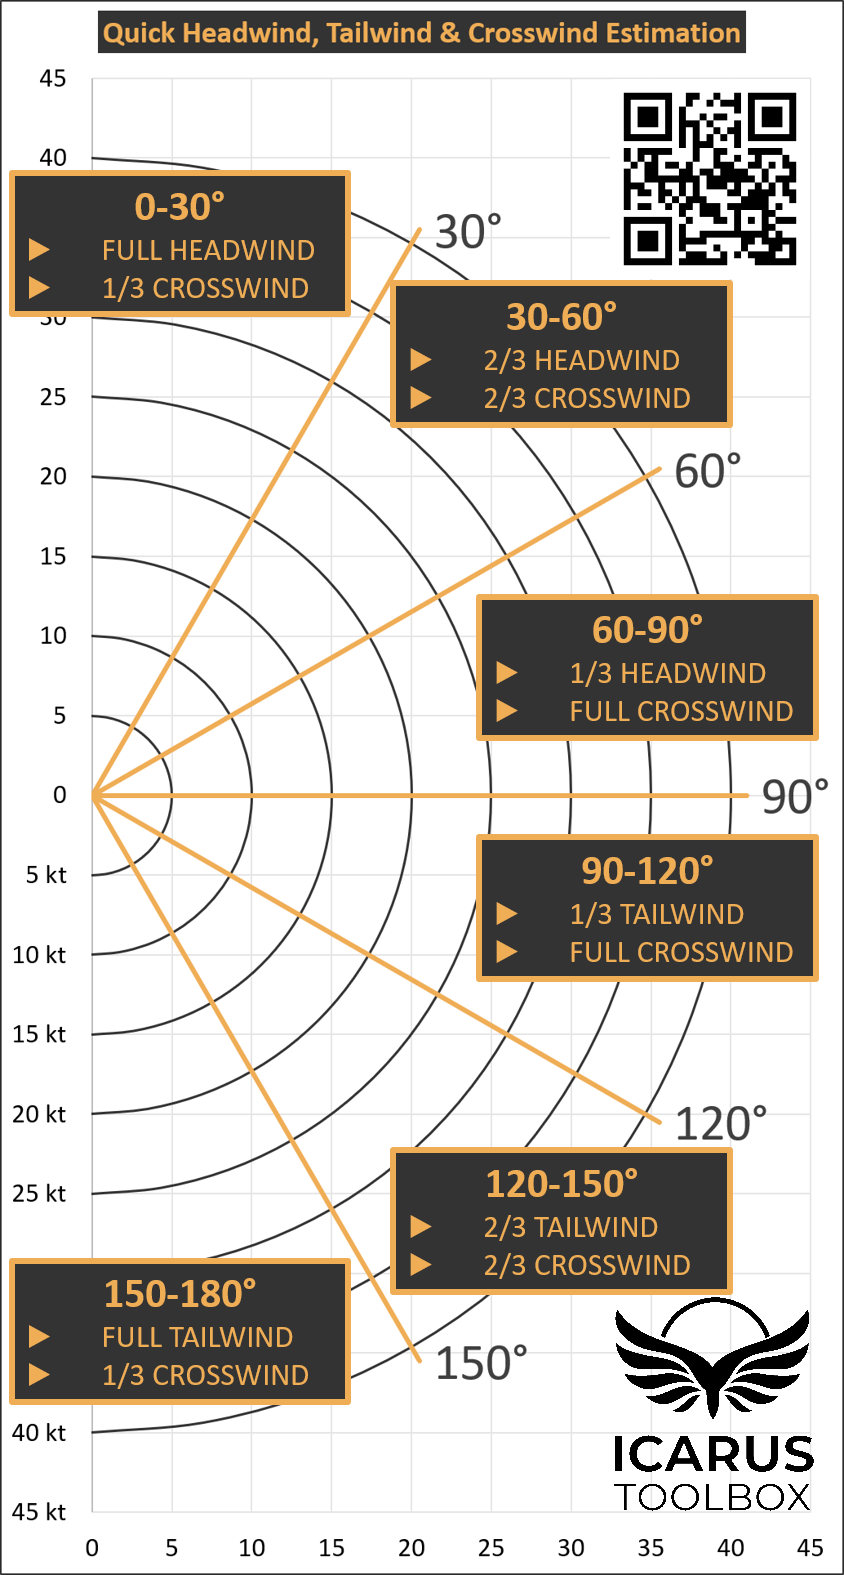
In flight, the actual wind rarely matches the forecast exactly. Rather than spending time performing precise trigonometric calculations, you can use this Quick Headwind, Tailwind & Crosswind Estimation chart to obtain a rapid and practical approximation of the wind components.
While it does not provide the exact values expected in a theoretical PPL examination, it is more than accurate enough for most operational decisions in light aviation. The goal is simple: spend less time calculating and more time focusing on flight preparation, situational awareness, and aircraft management.
Less time on calculations. More time flying safely. Welcome to Icarus Toolbox.
XIII. MASS AND BALANCE MOMENT
XIII.1 Basic Principle
A moment represents the turning effect created by a weight placed at a certain distance from a reference point.

With:
-
- Weight = mass or weight of the item;
- Arm = distance from the reference datum;
- Moment = weight effect around the datum.
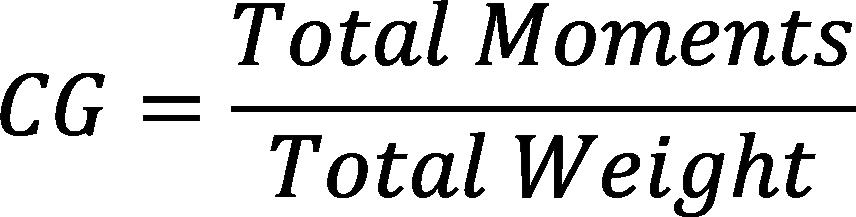
The aircraft centre of gravity is found by comparing the total moments with the total weight.
XIII.1.1 Adding a Mass
When adding a mass to the aircraft, the new CG can be calculated with:
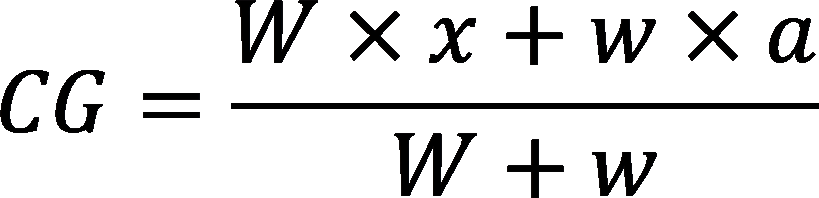
Where:
-
- W = original aircraft weight;
- x = original CG arm;
- w = added weight;
- a = arm of the added weight.
XIII.1.2 Moving a Mass
If a mass is already inside the aircraft and is moved from one position to another, the total aircraft weight does not change, but the CG moves.
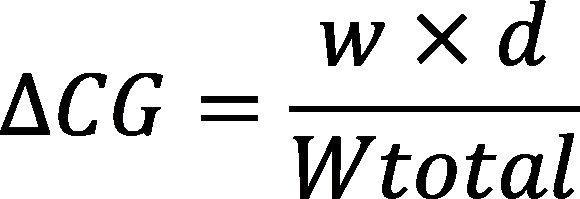
Where:
-
- ΔCG = CG displacement;
- w = moved weight;
- d = distance the weight is moved;
- Wtotal = total aircraft weight.
If the mass is moved forward, the CG moves forward, if the mass is moved aft, the CG moves aft.
XIV. FUEL MATHEMATICS AND DENSITIES
XIV.1 Fuel Used
Fuel used depends on fuel flow and time.

Example:
-
- Fuel flow: 30 L/h
- Flight time: 2 h

XIV.2 Endurance
Endurance is the time the aircraft can fly with the fuel available.

Example:
-
- Fuel on board: 120 L
- Fuel flow: 30 L/h
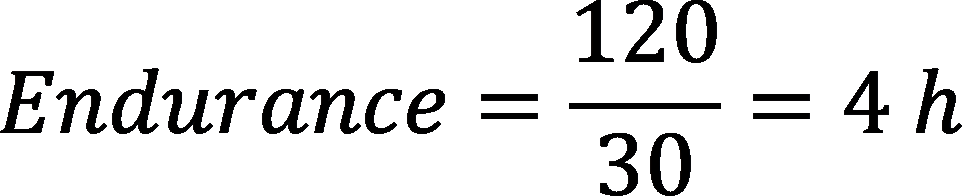
This is theoretical endurance. In real flight, required reserves must always be kept. For detailed fuel planning rules, refer to our dedicated article: Minimum Fuel Requirements in NCO.

XIV.3 Range
Range is the distance the aircraft can fly.

Example:
-
- Groundspeed: 100 kt
- Endurance: 4 h

Range depends on groundspeed, not TAS. A headwind reduces range over the ground. A tailwind increases it.
XIV.4 Fuel Mass and Fuel Volume
Fuel may be expressed as volume, such as litres or US gallons, or mass, such as kilograms or pounds.
To convert volume into mass:

To convert mass into volume:

XIV.5 Common Fuel Densities
Avgas 100LL:
-
- approximately 0.72 kg/L
- approximately 6.0 lb/US gal
Jet A-1:
-
- approximately 0.80 kg/L
- approximately 6.7 lb/US gal
These are practical values. Always use the value required by the POH/AFM, operator procedure, or local fuel documentation when accuracy is required.
EXAMPLE
50 L of Avgas 100LL:
Mass = 50 × 0.72 = 36 kg
50 L of Jet A-1:
Mass = 50 × 0.80 = 40 kg
10 US gal of Avgas 100LL:
Mass ≈ 10 × 6.0 = 60 lb
10 US gal of Jet A-1:
Mass ≈ 10 × 6.7 = 67 lb